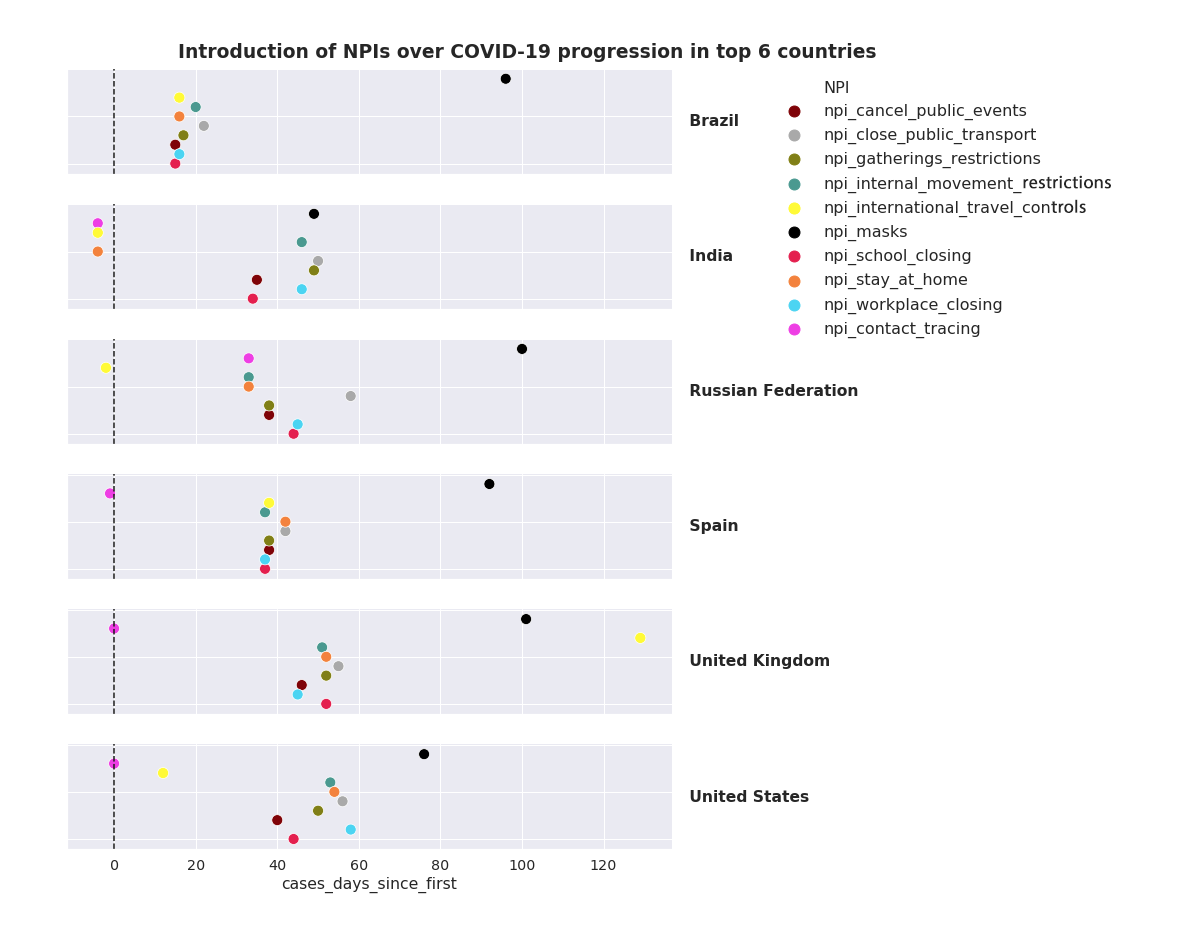
The Royal Society DELVE initiative has put together a global dataset on COVID19. The dataset has been consolidated from multiple sources and includes 62 fields for each country that range from the weather, Non Pharmaceutical Interventions (NPI) to Case, Test and Mobility numbers. It is a big set and some of the fields contain a number of variables so to begin exploring this data I thought it would be reasonable to examine how fast the most and least affected countries implemented NPI’s such as border control, face mask policy and contact tracing.
From the figure below a couple of things stand out, most of the worst affected countries implemented the bulk of their NPI’s around 40-60 days after their first case was detected. Further, apart from India a face mask policy was not implemented until the 80-100 day mark. It is also worth noting that the United Kingdom never closed their borders.
Looking at graphs below we can see that Greece, Hungary and New Zealand introduced the bulk of their NPI’s between 0-20 days after their first detected case and New Zealand implemented international travel controls about 20 days before their first case. It’s widely accepted that those countries that locked down hard and fast have been the most successful at combating the virus, as of June 16th New Zealand has eradicated it. So what is perhaps more interesting is that countries like Australia, Thailand and Vietnam which implemented NPI’s around the 60 day mark with a wider spread have also been very successful.
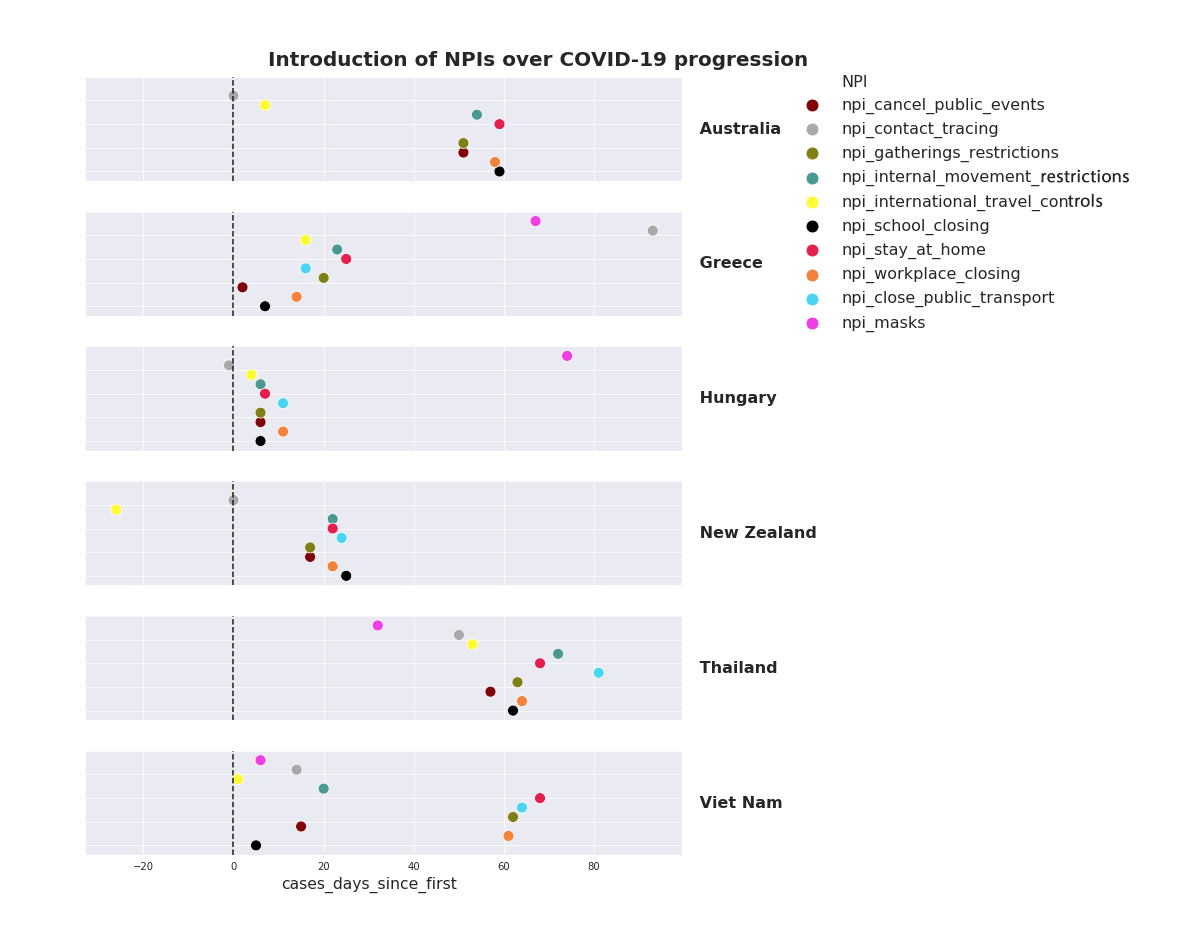
There are a large number of dimensions in the dataset to explore but based on the NPI graphs above one interesting question is, how have Australia, Thailand and Vietnam been relatively successful when their NPI’s and timing is not that different to some of the most affected countries.
Looking at those three countries more closely we can see that Vietnam and Australia closed their borders quiet fast but Thailand did not. We can also see that Thailand and Vietnam introduced a face mask policy earlier but Australia never did. It is also worth noting that during the peak of the outbreak it was summer in the southern hemisphere and of course Thailand and Vietnam are on the equator.
Next we will examine the face mask policy, border closures and weather for Vietnam, Thailand Australia and compare that to Russia, the United Kingdom and Spain.
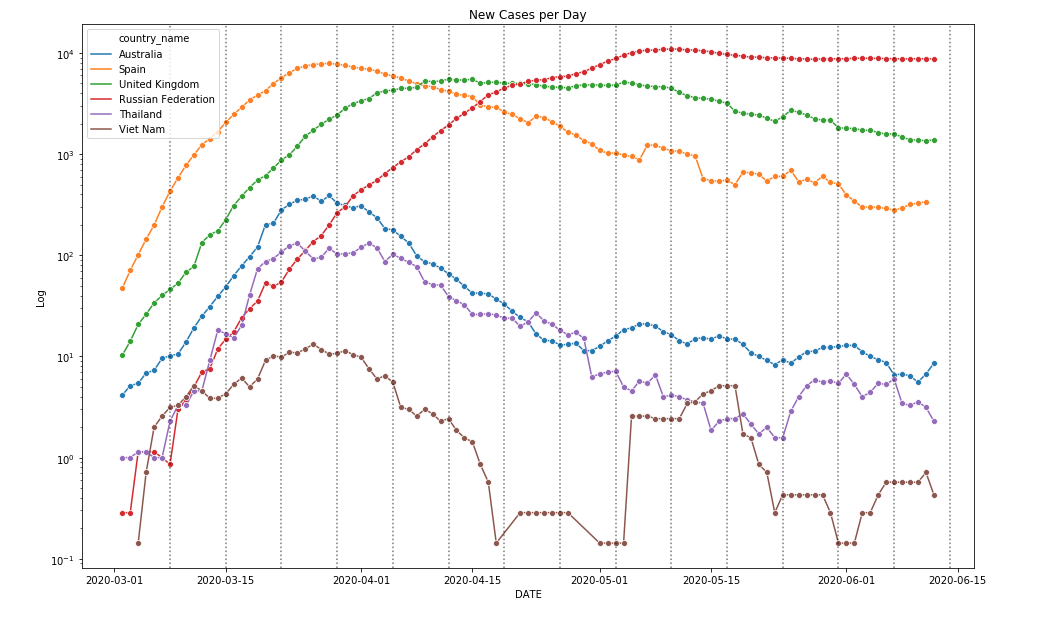
To help frame this it is worthwhile quantifying the above, the figure below plots the new cases per day. Vietnam is reporting zero to just a handful of cases per day and Thailand and Australia are reporting just a few more in the 5 to 10 range. It is my understanding that neither Thailand nor Vietnam has had a detected community transmission case for 2 -3 weeks, all of the cases are their citizens returning from overseas. Australia has had a few community transmission cases but once again most of the cases are citizens returning from overseas.
Contrast that to Russia with around 8000 new cases every day, Spain with around 400 per day and the United Kingdom with around 1100 per day. It is also worth noting that Spain has been relatively successful at getting their numbers down, from a peak of around 8000 per day in the last week March down to 400 per day by mid June.
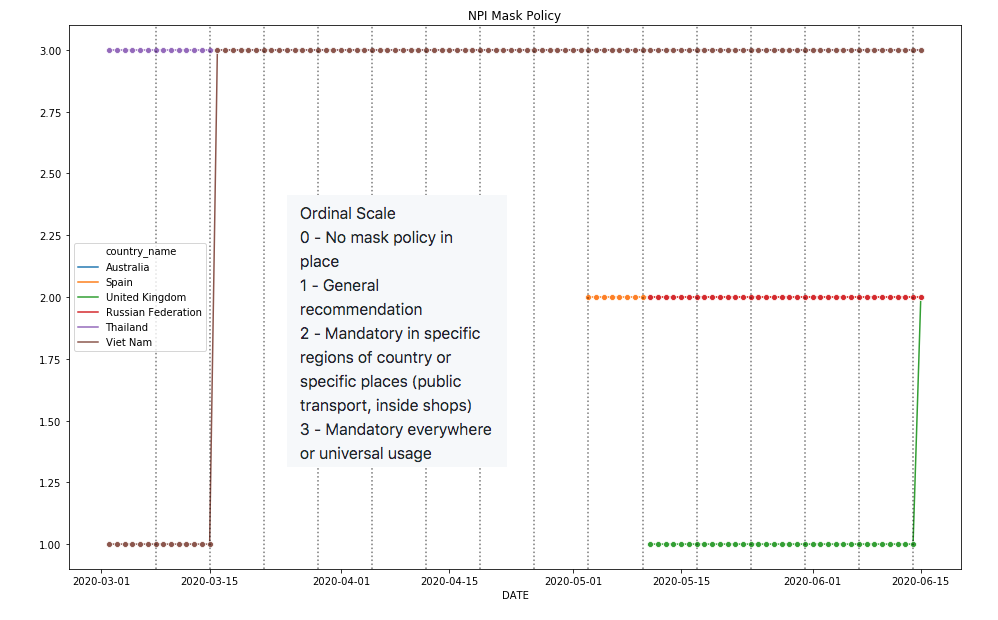
It is generally accepted that face masks use has been widely adopted in Asian countries and in the image below we can see that both Thailand and Vietnam implemented a mandatory everywhere face mask policy very early on. Spain and Russia implemented an intermediate face mask policy from May and the United Kingdom implemented the intermediate policy from mid June. Interestingly Australia never implemented a face mask policy.
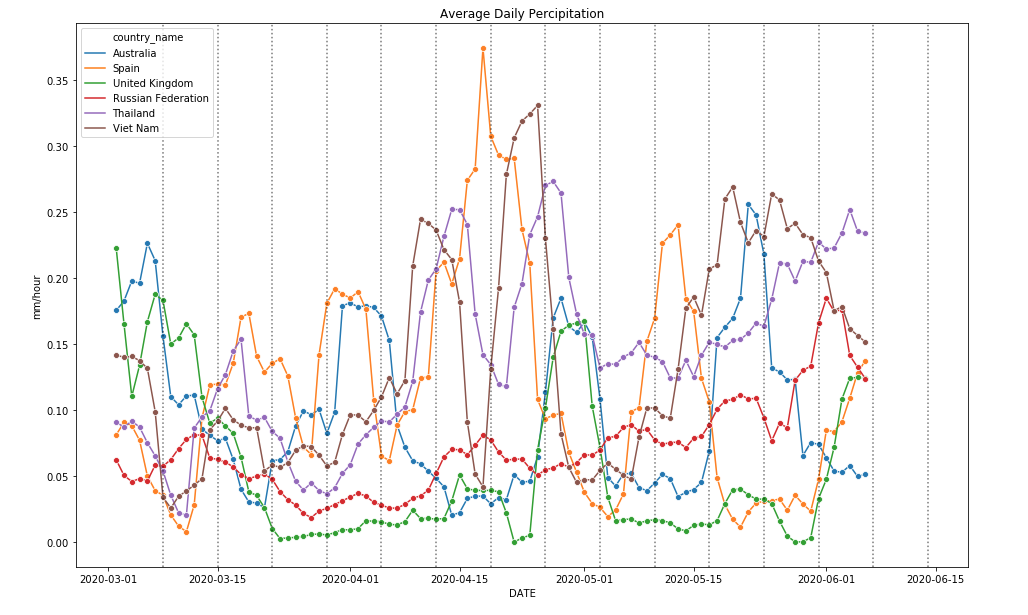
In the next few graphs we will examine the weather for the six countries of interest. The graph below presents the average daily precipitation in mm per hour. There does not appear to be any standouts, you might say that during the peak of the outbreak the UK and Russia were the driest and maybe Spain Vietnam and Australia received more rain but it is not obvious.
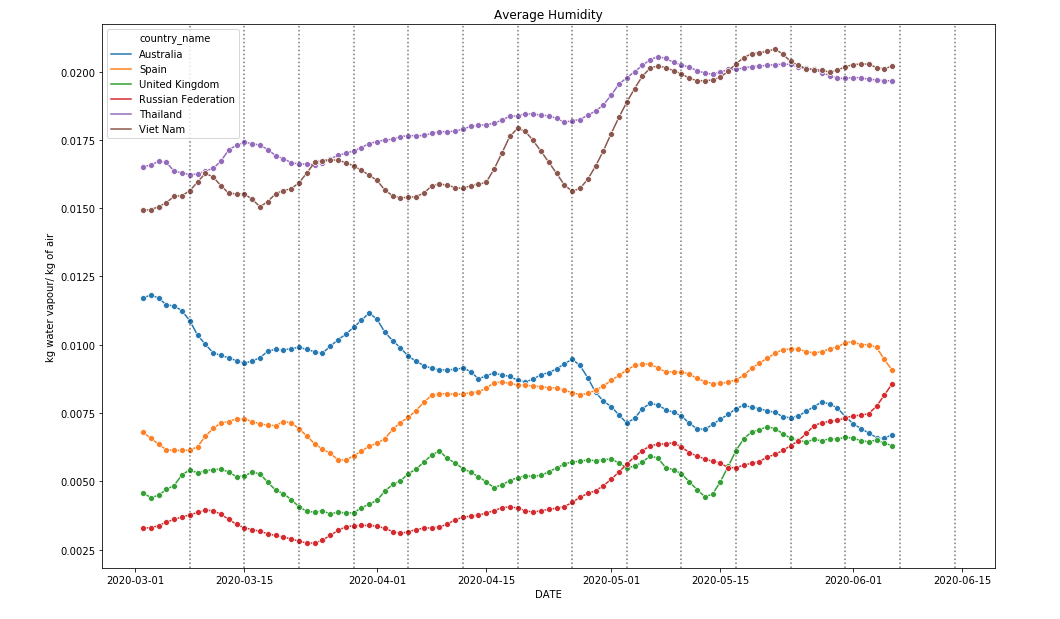
Looking at average humidity graph below it is fair to say that Thailand and Vietnam were more humid than all the rest for the entire duration. During March and the beginning of April Australia was more humid than Spain Russia and the UK.
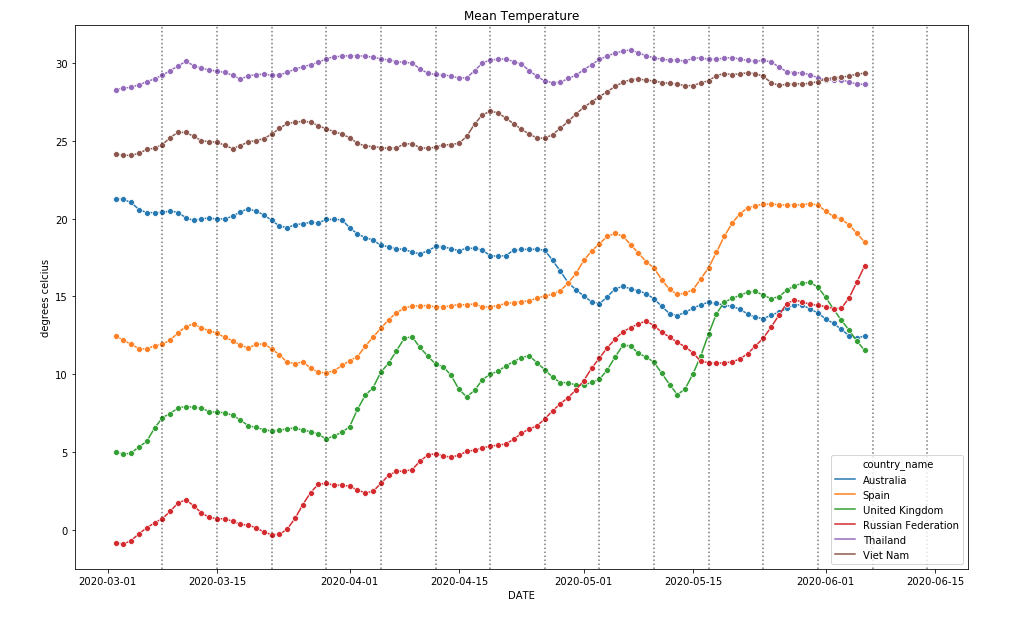
Mean Temperature is interesting in that during the peak of the outbreak Australia, Thailand and Vietnam were the hottest but towards the end of April the northern hemisphere started to warm up and Australia started to cool down.
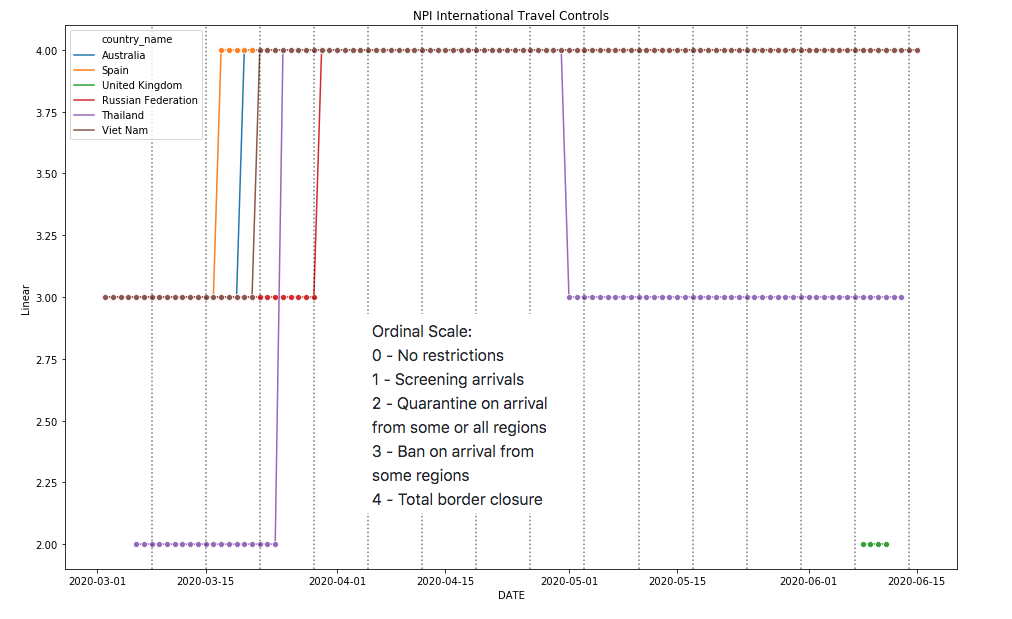
The graph below illustrates the NPI for International Travel Controls. The United Kingdom never closed their borders and only started to quarantine certain arrivals from the first week of June. All the other countries had closed their borders by the beginning of April. At the beginning of May Thailand started to repatriate it’s citizens from abroad but it’s borders were otherwise still closed.
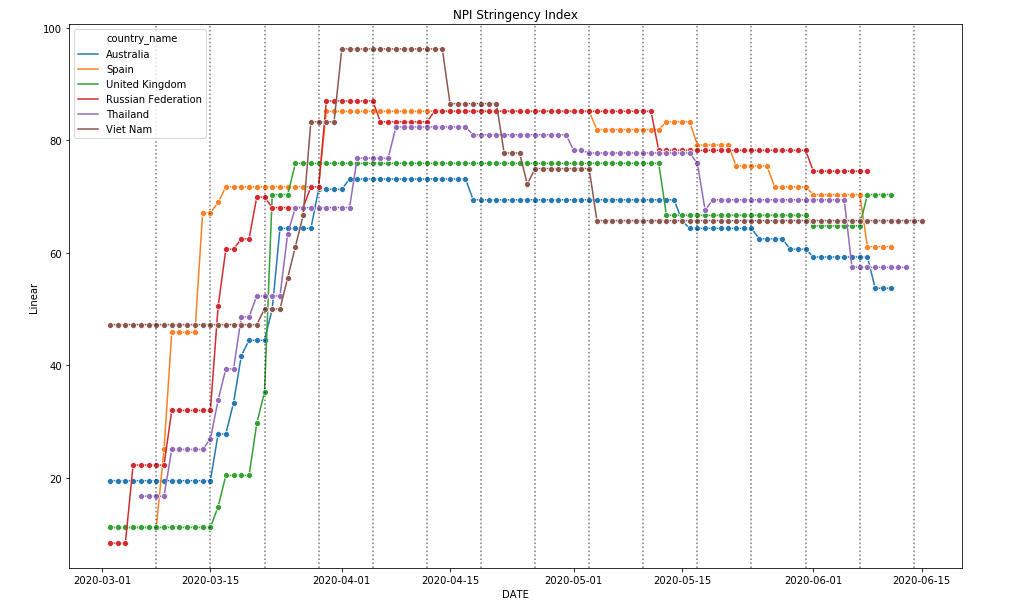
Lastly we will take a look at the Stringency Index which summarises the level of government response by considering a number of NPI’s and how strictly they were implemented. It is measured between 0 and 100 and a higher number represents stricter controls.
The NPI’s examined were
- schools closing
- workplace closing
- cancel public events
- gathering restrictions
- close public transport
- stay at home
- internal movement restrictions
- international travel controls
- public information
From the graph below we can see the Vietnamese government implemented very stringent NPI’s for two weeks around the beginning of April but the rest are fairly well bunched and followed the same trend.
I have a Bachelor of Science and am working on a Cyber Security Masters but am very much an amateur Data Scientist. With that in mind I would encourage you to have a look at the dataset and it is available from Royal Society DELVE Initiative.
There is no way to draw any conclusions from what has been presented here all we can do is infer that something might have some significance.
In the data we have examined there are only a few standout differences between the six countries presented. Looking at the face mask policy, Thailand and Vietnam, which are both densely populated implemented a strict mask policy. It is also interesting to note they were the hottest and most humid. Yet in all the other data they do not stand out, they weren’t that fast to close their borders and apart from two weeks at the beginning of April their NPI stringency was generally not that different to any other country. Then there is Australia who have also been very successful but they never implemented a face mask policy and in terms of the weather they were somewhere in the middle.
This is all a very cursory glance at the the data but nonetheless one might think that temperature and face masks might make a difference. There are 62 fields for each country in the dataset to investigate but rather than look at each field and each country a better approach might be to implement a Machine Learning model. Some years ago I was playing with a Support Vector Machine model for predicting stock market prices. I wonder if I can alter that model to consume and train on this dataset and then make predictions, for example can it be trained to predict the correct number of total cases for a country based on what that country actually did and then if I change a policy or the temperature for that country does that make a difference to the total number of predicted cases. Could be interesting.